What Investment Analysis Tools Track Institutional Activity?
- andrew106220
- Apr 14
- 5 min read
Updated: May 5
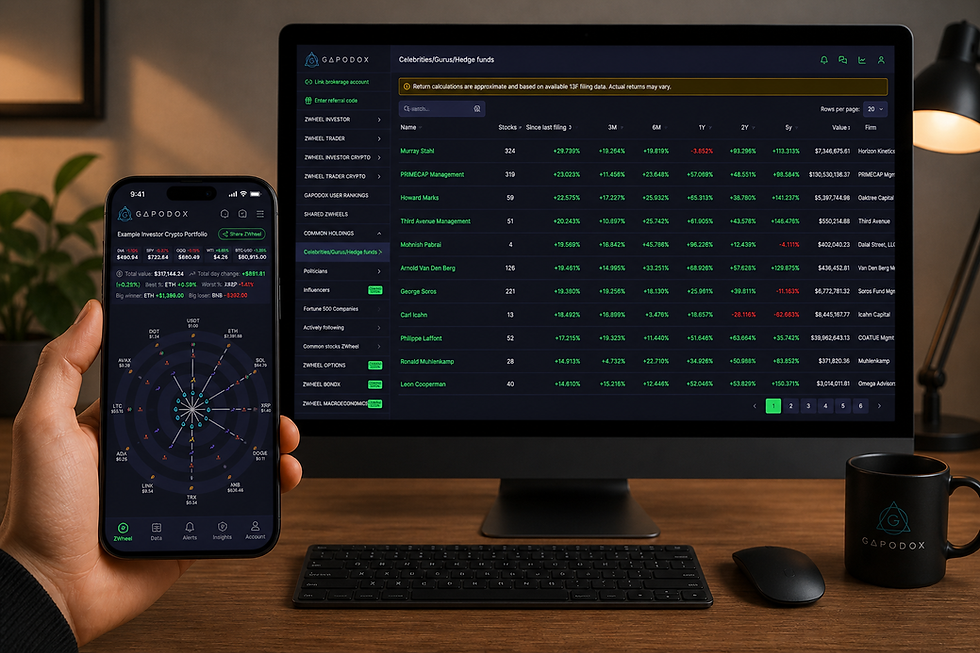
There is no shortage of investment analysis tools available today. From basic dashboards to advanced portfolio analysis software, the options are everywhere. The problem isn't access. It's how the data is being interpreted. More tools don't automatically lead to better decisions. Understanding what actually matters does. Gapodox goes beyond basic charts and indicators by combining institutional activity, insider trades, and your portfolio performance through features like Portfolio and Market Analytics, so you can see the full picture of market behavior instead of isolated data points.
From basic dashboards to advanced portfolio analysis software, the options are everywhere. The problem isn't access. It's how the data is being interpreted. More tools don't automatically lead to better decisions. Understanding what actually matters does.
Why more data doesn't equal better decisions
It's easy to assume more information leads to better outcomes. In investing, that's rarely true.
Too many inputs from different financial analysis tools for investors can lead to overanalysis, conflicting signals, delayed decision-making, and false confidence.
Most traditional investment analysis tools focus heavily on price movement and historical indicators. Those are useful, but incomplete. They show what has happened, not necessarily what is happening now.
What do most investment analysis tools focus on?
Most investment analysis tools and portfolio analysis software focus on the same things: price charts, technical indicators, historical performance, and financial statements.
These features are standard across many financial analysis tools for investors. They're important, but they're only one layer of the market. They don't fully capture behavior - who is buying, who is selling, where capital is actually moving.
What investors are starting to pay attention to
A shift is happening in how investors use investment analysis tools.
Instead of focusing only on price and indicators, more attention is being placed on activity and behavior. That includes insider buying and selling, hedge fund positioning, institutional capital flows, and politician trading activity.
These signals are increasingly being integrated into modern platforms. Platforms like Gapodox combine these behavioral signals with traditional portfolio tracking, so you can see not just what stocks are doing, but who is driving that movement.
They help answer a different question: not just what a stock is doing, but who is driving that movement.
The gap between data and insight
Most investment analysis tools give you access to data. Fewer platforms help you connect it.
Looking at insider trades separately from institutional activity creates a fragmented view. Tracking your portfolio using basic tools without more advanced portfolio analysis software limits context.
The value comes from seeing how these pieces interact. That's where many financial analysis tools for investors fall short.
What should you look for in investment analysis tools?
If the goal is better decision-making, the focus should shift from quantity of data to quality of insight.
The most effective platforms tend to combine multiple sources into one view, including insider activity, institutional trades, and portfolio data. They provide behavioral signals showing who is buying and selling, not just how price is moving. They offer clear visualization through dashboards that highlight patterns instead of forcing you to interpret raw data manually. And they provide portfolio context so you can see how external activity relates to your own positions.
A better way to use investment analysis tools
Instead of jumping between different financial analysis tools for investors, a more effective approach is to centralize your data.
Rather than checking charts in one tool, reviewing filings in another, and tracking your portfolio somewhere else, you can use platforms that combine these layers.
Gapodox is a portfolio tracking platform that combines insider activity, institutional movement, and portfolio data in one dashboard. By combining these layers, it becomes easier to understand how different signals align. This reduces fragmentation and improves clarity.
Use investment analysis tools to simplify, not complicate
Investment analysis tools shouldn't complicate your process. They should simplify decisions.
That means focusing on signals instead of noise, understanding behavior not just price, and using financial analysis tools for investors that provide context.
When used correctly, investment analysis tools and portfolio analysis software should reduce complexity, not increase it.
See the data that actually moves markets
Most investment analysis tools show you price. Better tools show you behavior.
If you want to understand how markets actually move, you need more than charts. You need financial analysis tools for investors that surface activity, show capital flows, and connect that data to your own portfolio.
Gapodox is built to bring these layers together. Instead of switching between multiple tools, you can use one platform to combine insights typically spread across different portfolio analysis software and investment analysis tools.
Frequently Asked Questions
What are investment analysis tools?
Investment analysis tools are platforms that help investors evaluate stocks, portfolios, and market trends using financial and behavioral data. These tools range from basic charting software to advanced analytics platforms that combine price data, institutional activity, insider trades, and portfolio performance. The goal is to help investors make more informed decisions by providing context beyond just price movements.
Portfolio analysis software helps investors track performance, analyze holdings, and understand how their investments are positioned over time. Unlike basic tracking tools that show balances and returns, portfolio analysis software provides deeper insights into allocation, risk concentration, and performance drivers. Some platforms also integrate external signals like institutional activity and market trends to provide broader context.
What are financial analysis tools for investors?
Financial analysis tools for investors provide insights into market data, company performance, and investment trends to support better decision-making. These tools can include stock screeners, charting software, fundamental analysis platforms, and behavioral tracking systems. Modern financial analysis tools increasingly focus on combining multiple data sources, such as insider trades, hedge fund holdings, and AI-powered insights, to give investors a more complete picture of market activity.
Are investment analysis tools enough on their own?
No. Most investors combine multiple data sources, including behavioral signals and market activity, to get a complete picture. Investment analysis tools are most effective when they help you connect different types of data rather than viewing each signal in isolation. For example, combining price charts with institutional activity and insider trades provides more context than looking at any single metric alone.
How is Gapodox different from other investment analysis tools?
Gapodox combines multiple data layers, including insider activity, institutional movement, and portfolio tracking, into one platform to provide better context and insight. Unlike tools that focus only on price and technical indicators, Gapodox is a portfolio tracking and analytics platform that shows you how different types of market behavior connect. You can see your portfolio performance alongside hedge fund holdings, politician trades, and AI-powered insights in a single dashboard.


Comments